View the http redirect and response message from an external authentication provider using ETW


Recently I had to troubleshoot messages that were being sent from an web application hosted on IIS to an external authentication provider. The logs from the application wasn’t something closer to the metal and wasn’t really providing all the details. I really wanted something like fiddler for the webserver. I could have a ran network traces to troubleshoot the issue but the problem was it wasn’t happening consistently. It was sporadic. I knew there would be ETW traces that would have this information. The IIS web logs don’t capture this information.

Here is a example of the SAML authentication process

500px-SAML

In the application I was working with, IIS was the relying party and the user was to be authenticated with Identity Provider.

I wanted to troubleshoot the “AuthnRequest” and “Auth Resp” from and to the IIS. This can be applied to any external authentication like credit card authentication.

I fired my favorite tool Perfview and captured all the IIS traces along with other defaults. I wasn’t really interested in the .NET Code.

Here is the command line for Perfview to the IIS Providers

[gist https://gist.github.com/naveensrinivasan/86a6d7daac73484ef504]

If for some reason that does not work.  You could always use the additional providers in Perfview and add these providers which are IIS and HTTP providers.

[gist https://gist.github.com/naveensrinivasan/5ac34bdd047d2d80cc44]

I let perfview do its job and then stopped the trace when there was an issue.

Here are the ETW events that capture the SAML Request that was sent from IIS to the IDP

Event Name

  1. IIS_Trace/IISGeneral/GENERAL_RESPONSE_HEADERS
  2. Microsoft-Windows-IIS/EventID(47)
  3. IIS_Trace/IISGeneral/GENERAL_RESPONSE_ENTITY_BUFFER
  4. Microsoft-Windows-IIS/EventID(49)
  5. IIS_Trace/IISGeneral/GENERAL_REQUEST_HEADERS

SamlRequest

Here are the ETW events that capture the SAML Response that was being posted from the IDP to the IIS

  1. IIS_Trace/IISGeneral/GENERAL_REQUEST_ENTITY
  2. Microsoft-Windows-IIS/EventID(51)

samlresponse

With this I was able to troubleshoot message that was being sent and received to the IIS.

Getting my Yoga stats from Yogaglo


I am Yogi and have practiced some sort physical workout for a while now. IMHO physical strength/ movement have always attributed to better clarity in my life! This post shows how I managed to get my yogaglo stats to track and measure my practice.

NaveenSrinivasan-TRX

I am strong believer in habit loops and always have found that has worked a lot for me. One of the good books on this which I recommend to other ishttp://www.amazon.com/The-Power-Habit-What-Business/dp/081298160X and also another good resource is http://getupandcode.com/ which is a audio podcast fitness and technology.

I have been practicing Yoga for a while now and I would like to track my practice. I usually go to studio twice a week to be part of the Sangha and the rest 4-5 days I practice twice a day.

I knew yogaglo had my stats information stored in their site because when I logged into the site it did provide me with history. But I wanted the API to query based on the raw data. I wanted to track how often I worked and what kind of classes have I done. My goal was to work on the strengthening my core and I usually like to track that and API would help with this kind of information.

Thanks to tools like fiddler or http://mitmproxy.org/ I could look at the http traffic that was sent with the headers. The headers are important because it contained the authentication token information. FYI I have set yogaglo to remember my login information which meant I have cookies that it could send across part of the http request.

Here is the code to download the yogaglo stats

[gist https://gist.github.com/naveensrinivasan/2e40f409bf6c386766c6]

You could take the json and dump into excel and get some amazing stats using powerquery.

I am not a excel whiz to do it. I used the json to convert it to C# objects usinghttp://json2csharp.com/ and here is the code it generated.

[gist https://gist.github.com/naveensrinivasan/0cf3cecede742c3587dc]

With that here is a simple query to get total duration by date.

[gist https://gist.github.com/naveensrinivasan/213c2092babc23d7c772]

Use Eventsource to get the duration of a Start Stop of Custom ETW events


The EventSource library provides an option to get duration of Custom ETW start and stop events and when used with Perfview we could leverage this to stop tracing when the duration is more than what we expect.

What it is for example ,there could an external API call the application makes that has to be traced with the start and when it finishes then the stop of the event is called. Ideally we would have a ability to view the duration of these events similar to ASP.NET calls.  The EventSource Library along with Perfview provides this ability to view the duration between the start and stop events.

Here is a code sample with CustomEvent

[gist https://gist.github.com/naveensrinivasan/7e54c72dc628ae7da69e]

And here is the output from Perfview with the duration.

StartStopETW

How often we want to capture trace when the performance of our custom event goes down to figure out what went wrong. This is very much possible with this.

Here is the command

PerfView /StopOnEtwEvent:*CustomEvent//Start;TriggerMSec=2000 collect

This would record the ETW events on a flight recorder mode and would stop when the CustomEvent took more than 2 seconds. This is one of the features I really like because it is a great asset to DevOps to see when the issue arises.

Here is an example of Perfview Stop reason that shows why perfview stopped which clearly  indicates when the duration of event took more than 2000 milliseconds.

PerfviewStopReason

There is a bug in perfview that would not record Stop triggered events. I have reported this and I hope this would be fixed in the next public release.

The source code for these samples are here

https://github.com/naveensrinivasan/ETWSamples

Log dynamic Custom objects in ETW using EventSource


With the latest release of EventSource we could create dynamic events without having to create class that inherits from EventSource. This is will be not be good for Performance.

Using these methods we could either log Anonymous objects or Classes that have the EventData Attribute applied to it. The caveat is that these objects public properties alone will be serialized. These properties have to be of native types like string,int,datetime, guid , IEnumerable. If you don’t want a property to be serialized you could apply the attribute EventIgnore.

The source code for this repository is in https://github.com/naveensrinivasan/ETWSamples

Here is the sample code of using  Dynamic eventsource to generate ETW traces

[gist https://gist.github.com/naveensrinivasan/83ded09f7d754ad0b3a8]

Here is the trace from Perfview generated using

[gist https://gist.github.com/naveensrinivasan/11a793b35a18fc9546dd]

DynamicETW

The case of slow Visual Studio startup


In this post I would use Perfview /ETW to diagnose the delayed start-up of visual studio.

To analyze the problem start-up VS within Perfview as a run command

[gist https://gist.github.com/naveensrinivasan/5eb6406d6d38f2143acb]

This would launch visual studio and collect etw traces. I have also enabled CodeMarkers , which is ETW traces for Visual Studio in case if you want to trace any extensions performance.

perfview-mainAfter it completes I choose the CPU Stacks and filtered with devenv.exe process.

On the CPU window I choose call-tree tab which displays the threads.perfviewcpuviewThe most amount of time is spent on the start-up thread and that is what we want to zoom into.

groupedcall-stacksWhen I expanded it does not show the information and everything is grouped into OTHER which does not help me.

The reason for that is perfview groups call-stacks for better viewing. I cleared the “groupparts” textbox and then expanded the start-up thread.

actualcallstacksFrom the call-stacks I could make almost 42% of time is spent on Xamarin and DevExpress extensions within VS. Now I could turn them off and have a better performance.

Perfview is great tool for identifying where the time is being spent!

Managed Stack Explorer using ClrMD


How often we run into an issue in the field where we just want to see the managed call-stack where the exception is or where the thread is hung. One of the options is debugger or something like ETW.

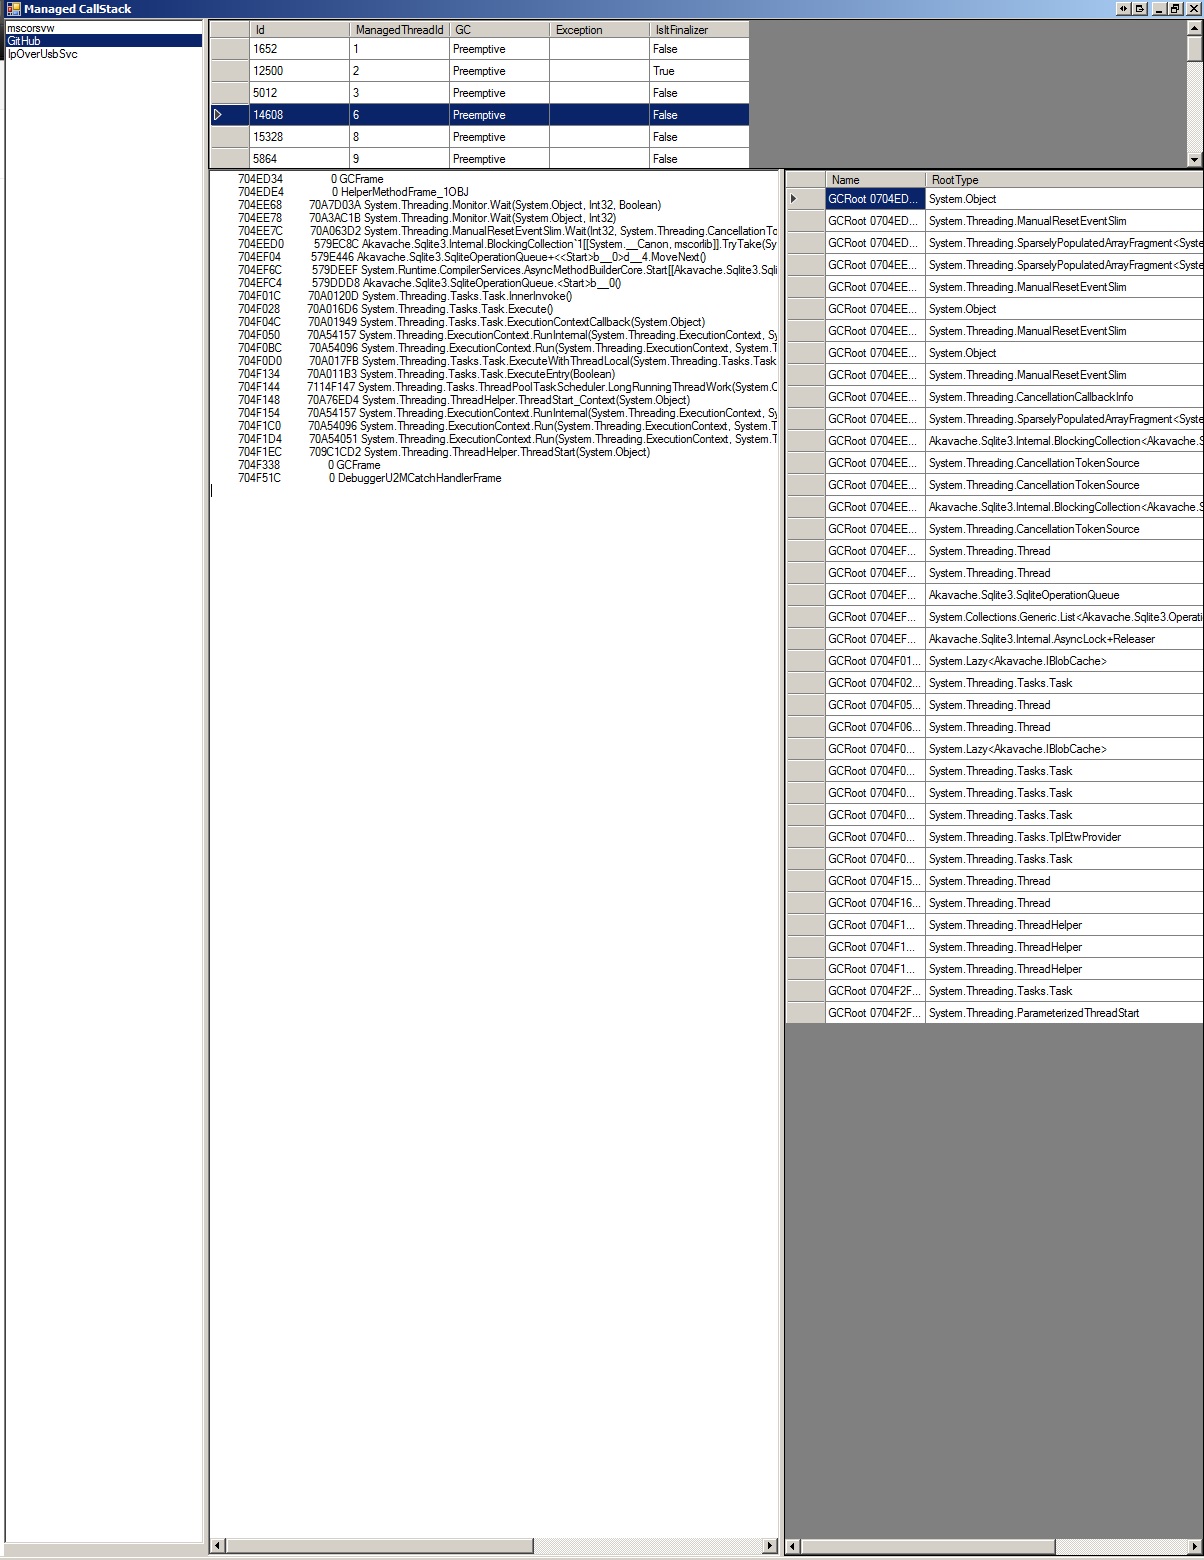
So I built a managed stack explorer

http://naveensrinivasan.github.io/ManagedStackExplorer/

Managed Stack Explorer provides call stack for .NET applications using managed code with thread local variables. The API as of now does not provide values for the local variables. When it is available we can update it.

It is a single executable without any other dll’s. It uses Costura to embed dll.

The debug shim works specific to processor and would not be able to get call-stacks if it is not. So x86 exe cannot get call-stacks of x64. That’s reason for x86 and x64 specific exe’s. There is no difference in code other than how it is compiled.

It is work in progress and I would love some feedback and code contributions.

The github site also has link to download the pre-complied executables.

Measure GC Allocations and Collections using TraceEvent


In this post I will explore  how we could use TraceEvent to measure our code (even at function level) for GC Allocations and Collections.

Save this with “.linq” extension and then open in  linqpad.

<Query Kind="Program">
<NuGetReference>MeasureIt.exe</NuGetReference>
<NuGetReference>Microsoft.Diagnostics.Tracing.TraceEvent</NuGetReference>a
<NuGetReference>Rx-Core</NuGetReference>
<NuGetReference>Rx-Interfaces</NuGetReference>
<NuGetReference>Rx-Linq</NuGetReference>
<NuGetReference>Rx-Main</NuGetReference>
<Namespace>Microsoft.Diagnostics.Tracing</Namespace>
<Namespace>Microsoft.Diagnostics.Tracing.Parsers</Namespace>
<Namespace>Microsoft.Diagnostics.Tracing.Parsers.Clr</Namespace>
<Namespace>Microsoft.Diagnostics.Tracing.Session</Namespace>
<Namespace>System</Namespace>
<Namespace>System.Collections.Generic</Namespace>
<Namespace>System.Diagnostics</Namespace>
<Namespace>System.Diagnostics.Tracing</Namespace>
<Namespace>System.IO</Namespace>
<Namespace>System.Reactive.Linq</Namespace>
<Namespace>System.Threading</Namespace>
<Namespace>System.Threading.Tasks</Namespace>
<Namespace>PerformanceMeasurement</Namespace>
<Namespace>System.Reactive.Subjects</Namespace>
</Query>
void Main()
{
/*
Measure GC Allocations and Duration it take to run a piece of code.
It uses MeasureIt https://www.nuget.org/packages/MeasureIt.exe/ along with
TraceEvent https://www.nuget.org/packages/Microsoft.Diagnostics.Tracing.TraceEvent/
for figuring out GC Allocations.
*/
var useAny = true;
var loremipsum = @"Lorem ipsum dolor sit amet, consectetuer adipiscing elit.
Aenean commodo ligula eget dolor. Aenean massa.
Cum sociis natoque penatibus et magnis dis parturient montes,
nascetur ridiculus mus. Donec quam felis, ultricies nec, pellentesque eu,
pretium quis, sem. Nulla consequat massa quis enim. Donec pede justo, fringilla
vel, aliquet nec, vulputate eget, arcu. In enim justo, rhoncus ut, imperdiet a,
venenatis vitae, justo. Nullam dictum felis eu pede mollis pretium. Integer
tincidunt. Cras dapibus. Vivamus elementum semper nisi. Aenean vulputate eleifend
tellus. Aenean leo ligula, porttitor eu, consequat vitae, eleifend ac, enim.
Aliquam lorem ante, dapibus in, viverra quis, feugiat a,";
var items = loremipsum.Split(new [] {' '}).Distinct().ToList();
var lookfor = "pede";
//Function that needs to be measured.
var runPerf =new Action(() => {
if (!useAny) // Based on the flag run either of the code.
{
foreach (var item in items)
{
if (item == lookfor) {
return;
}
}
}
else
{
items.Any (i => i == lookfor);
}
});
LinqPadUX.Measure.ActionWithGC(runPerf,500);
}
public static class ObserveGCEvents
{
// Filter because the traceevent reports for every .NET application running.
const string FilterProcessName = "LINQPad.UserQuery";
public static void ActionWithGC(this FluentMeasure measure,
Action runPerf,int counter = 1000)
{
if (TraceEventSession.IsElevated() != true)
{
throw new
Exception(@"You have the run this process as
elevated to capture traces.");
}
// create a real time user mode session for capturing ETW Traces
var userSession = new TraceEventSession("ObserveGCAllocs");
//Subscriber for GC ETW Events
userSession.EnableProvider(
ClrTraceEventParser.ProviderGuid, TraceEventLevel.Verbose,
(ulong)(ClrTraceEventParser.Keywords.GC));
//Observable for GC Allocation
IObservable<GCAllocationTickTraceData> gcAllocStream =
userSession.Source.Clr.Observe<GCAllocationTickTraceData>();
//Observable for GC Collection
IObservable<GCHeapStatsTraceData> gcCollectStream
= userSession.Source.Clr.Observe<GCHeapStatsTraceData>();
var alloc = gcAllocStream
.Select(data => new {ProcessName = GetProcessName(data.ProcessID),
Amount = data.AllocationAmount / 1000,
Type = data.TypeName,
AllocationKind = data.AllocationKind})
/* Filter*/ .Where(item => item.ProcessName.Contains(FilterProcessName))
.GroupBy(item => item.Type)
.Select(item => new {Type = item.Key,
AllocationAmount =
item.Select(x => x.Amount).Average() ,
Count = item.Count().FirstAsync()
}).Dump("GC Allocation");
gcCollectStream.Select(data =>
new CollectionStats {ProcessName = GetProcessName(data.ProcessID),
Gen0 = data.GenerationSize0 / 1000000.0,
Gen1 = data.GenerationSize1 / 1000000.0,
Gen2 = data.GenerationSize2 / 1000000.0,
Gen3 = data.GenerationSize3 / 1000000.0,
GCHandleCount = data.GCHandleCount,
PinnedObjectCount = data.PinnedObjectCount})
.Where(item => item
.ProcessName.Contains(FilterProcessName))
.Dump("GC Collection Stats");
/* Starts Processing ETW Events */
Task.Run(() => userSession.Source.Process());
Task.Run( () =>LinqPadUX.Measure
.WithIterationCount(counter)
/* Run's the function */ .Action(runPerf).Dump())
.ContinueWith((t) =>
/* Stops the Trace session */ userSession.Stop());
}
private static string GetProcessName(int processID)
{
// Only keep the cache for 10 seconds to avoid issues with process ID reuse.
var now = DateTime.UtcNow;
if ((now - s_processNameCacheLastUpdate).TotalSeconds > 10)
s_processNameCache.Clear();
s_processNameCacheLastUpdate = now;
string ret = null;
if (!s_processNameCache.TryGetValue(processID, out ret))
{
Process proc = null;
try { proc = Process.GetProcessById(processID); }
catch (Exception) { }
if (proc != null)
ret = proc.ProcessName;
if (string.IsNullOrWhiteSpace(ret))
ret = processID.ToString();
s_processNameCache.Add(processID, ret);
}
return ret;
}
private static Dictionary<int, string> s_processNameCache =
new Dictionary<int, string>();
private static DateTime s_processNameCacheLastUpdate;
}
class CollectionStats
{
public string ProcessName { get; set; }
public double Gen0 { get; set; }
public double Gen1 { get; set; }
public double Gen2 { get; set; }
public double Gen3 { get; set; }
public int GCHandleCount { get; set; }
public int PinnedObjectCount { get; set; }
}
class AllocationData
{
public string Type { get; set; }
public IObservable<int> ItemSize { get; set; }
public IObservable<int> Count { get; set; }
}

Here is the TL;DR

Why would I want to know GC events on a function level? Doesn’t the PerfMon counter  provide that information on an application level? Isn’t Premature optimization root of all evil?

Yes, for most of the part Premature optimization is not necessary. And PerfMon GC counter’s would give answers for the whole application. But it is usually after we build the application and when we start running into performance issues we start looking at them.

The motivation behind this are two things Measure Early and Often for Performance and Essential Truths Everyone Should Know about Performance in a Large Managed Codebase

If you haven’t read or watched the above video please do it. It let’s us know why and how to do it.

In the above video Dustin talks about Roslyn code base and how they used Perfview to measure Roslyn code base and identify potential bottlenecks early to avoid Perf issues.

One of the key differences between managed code and native code with respect to performance is GC. If GC is working hard then your application might not be able to get the performance that you are expecting. GC is good but if we don’t know which calls allocate what amount of data then it is an issue. Especially if you have a section code that is hit very often and which requires a lot of Perf, it is good know where the allocations are coming from. It is not explicit always.

In the above video Dustin shows few examples of Roslyn code where they were able to identify subtle issues that could allocate a lot when you are trying to get the most out of the code.There is also Roslyn Heap Allocation Analyzer which looks at the code help us identify allocations which isn’t necessary. It is a cool project.

I took one of the examples from the video as a motivation to check if  I could measure and make it a utility in my toolbox to help me when I need one.

var useAny = false;
var loremipsum = @"Lorem ipsum dolor sit amet, consectetuer adipiscing elit. Aenean commodo
ligula eget dolor. Aenean massa. Cum sociis natoque penatibus et magnis dis parturient montes,
nascetur ridiculus mus. Donec quam felis, ultricies nec, pellentesque eu, pretium quis, sem.
Nulla consequat massa quis enim. Donec pede justo, fringilla vel, aliquet nec, vulputate eget,
arcu. In enim justo, rhoncus ut, imperdiet a, venenatis vitae, justo. Nullam dictum felis eu
pede mollis pretium. Integer tincidunt. Cras dapibus. Vivamus elementum semper nisi. Aenean
vulputate eleifend tellus. Aenean leo ligula, porttitor eu, consequat vitae, eleifend ac,
enim. Aliquam lorem ante, dapibus in, viverra quis, feugiat a,";
var items = loremipsum.Split(new [] {' '}).Distinct().ToList();
var lookfor = "pede";
var runPerf =new Action( () => {
if (!useAny)
{
foreach (var item in items)
{
if (item == lookfor) {
return;
}
}
}
else
{
items.Any (i => i == lookfor);
}
});
view raw gistfile1.cs hosted with ❤ by GitHub

In the above example I am trying look for a word “pede” in the lorem ipsum text. The code could get it using “foreach” or using the “Any” operator. I would like to run this few times to check what are the allocations and how long does it take. I used LINQPad as a scratch pad.

Here is the result of GC Allocations of using “Any” for 500 iterations and NOT the foreach

GCAllocations

The were 118 allocations of Enumerator and 146 allocations Func. GC usually allocates 100K each time it allocates that’s what is shown in the allocation amount column.

And here is GC Allocations when using “foreach”

GCAllocationWithForEach

There are hardly any new allocations compared to the previous one.

Here is the GC Collections when using  “Any”

GCCollection

There were 18 GC Collections using Any.

Here it is using foreach  and there were 0 collections.

ZeorCollections

Here is measure it time duration results using Any

MeasureWithAny

And here it is using Foreach

MeasureWithForEach

Look ma I figured out why my ETW EventSource isn’t tracing


The EventSource class in the framework 4.5 helps in writing custom ETW tracing.

When using EventSource class built within the framework, if the order of the methods don’t match ordinal number position in the class it would fail generating ETW traces. The EventSource has dependency on the order of the methods in the class.

This code would produce a valid ETW traces

using System.Diagnostics.Tracing;
namespace ETWSample
{
public sealed class TestEvent : EventSource
{
static public TestEvent Trace = new TestEvent();
public void WriteEvent(string content)
{
WriteEvent(1, content);
}
public void WriteDetailedEvent(int id,string content)
{
WriteEvent(2,id, content);
}
}
}
view raw GoodETWTrace hosted with ❤ by GitHub

This one would fail producing any ETW Traces.

using System.Diagnostics.Tracing;
namespace ETWSample
{
/// <summary>
/// This event would not be traced because the order of the
/// function should be in the order of the parameters.
/// </summary>
public class FailedEvent : EventSource
{
static public FailedEvent Trace = new FailedEvent();
public void FailedDetailedEvent(int id, string content)
{
WriteEvent(2, id, content);
}
public void FailedTraceEvent(string content)
{
WriteEvent(1, content);
}
}
}
view raw FailedETWTrace hosted with ❤ by GitHub

The difference between them are the order of the methods. If you notice in the failing ETW tracing class the FailedTraceEvent is Second and the FailedDetailedEvent is first which is causing the trace not to be generated. The actual exception text would

Event FailedDetailedEvent is givien event ID 1 but 2 was passed to WriteEvent.

It’s one of those quirks that I ran into when building ETW tracing.

How to troubleshoot these kind of failures?

By default these kind of failed ETW exceptions would not be raised to be handled by the client code. The reason being,in production if you enable ETW tracing and all of a sudden the application crashes would not be something that we would want.

To troubleshoot this, use ETW tracing for exceptions. Use ETW to trace custom ETW failures. How cool is this?  My choice of tool is Perfview.

may-3-2015-etw-exception

Within Perfview in the Events Window I enter Test|Ex in the filter text box which is shown in the above picture. FYI filter text box supports Regular expression. So by entering Test|Ex, I am filtering events with Test or Ex which for exceptions. With that information I could filter all the TestEvent’s and any exceptions that have been raised which shows ArgumentException.

The call-stack of the ArgumentException shows on the static contructor .cctor of  FailedEvent.

may-3-2015-exception-callstack

Making an Image Easier to Debug


I am doing security review for a managed application which is obfuscated. So I am doing a lot of   disassembling code at runtime using Windbg. One of the issues is that code gets JIT optimized because of the retail build. This makes it harder for me debug when mapping it back. Realized  that I could turnoff  JIT Optimization’s using the ini file.

[.NET Framework Debugging Control]
GenerateTrackingInfo=1
AllowOptimize=0

Another use of feature which I guess wasn’t really intended for.


Updating .NET String in memory with Windbg


In this post I would show a simple trick to update .NET strings in memory with Windbg. The caveat is make sure the string that you’re updating is long enough to fit into the string buffer. If not there would be a memory corruption.

Here is a simple windows form application with title “Good”

The goal is to update the title from “Good” to “Bad”.


button1.Click += (s,b) => Text = _caption;

I am updating the title in the button click.

Here is the actual string object within the debugger

0:006> !do 0294d0a0
Name:        System.String
MethodTable: 59b9fb64
EEClass:     598d8bb0
Size:        22(0x16) bytes
File:        C:\Windows\Microsoft.Net\assembly\GAC_32\mscorlib\
v4.0_4.0.0.0__b77a5c561934e089\mscorlib.dll
String:      Good
Fields:
      MT    Field   Offset                 Type VT     Attr    Value Name
59ba2b30  40000ed        4         System.Int32  1 instance        4 m_stringLength
59ba1f80  40000ee        8          System.Char  1 instance       47 m_firstChar
59b9fb64  40000ef        8        System.String  0   shared   static Empty
    >> Domain:Value  004b0308:02941228 <<

I would be using the e  command to update the memory. The ezu command is used for updating  Null-terminated Unicode string .

Notice the first character starts in the 8th offset from the above. So we would have start updating the string only from the 8th offset. The first 8 bytes of object are for syncblock index and method table pointer.

Here is the command to update the string memory.

ezu 0294d0a0+8 “Bad”

And the updated form title.