
The EventSource class in the framework 4.5 helps in writing custom ETW tracing.
When using EventSource class built within the framework, if the order of the methods don’t match ordinal number position in the class it would fail generating ETW traces. The EventSource has dependency on the order of the methods in the class.
This code would produce a valid ETW traces
| using System.Diagnostics.Tracing; | |
| namespace ETWSample | |
| { | |
| public sealed class TestEvent : EventSource | |
| { | |
| static public TestEvent Trace = new TestEvent(); | |
| public void WriteEvent(string content) | |
| { | |
| WriteEvent(1, content); | |
| } | |
| public void WriteDetailedEvent(int id,string content) | |
| { | |
| WriteEvent(2,id, content); | |
| } | |
| } | |
| } |
This one would fail producing any ETW Traces.
| using System.Diagnostics.Tracing; | |
| namespace ETWSample | |
| { | |
| /// <summary> | |
| /// This event would not be traced because the order of the | |
| /// function should be in the order of the parameters. | |
| /// </summary> | |
| public class FailedEvent : EventSource | |
| { | |
| static public FailedEvent Trace = new FailedEvent(); | |
| public void FailedDetailedEvent(int id, string content) | |
| { | |
| WriteEvent(2, id, content); | |
| } | |
| public void FailedTraceEvent(string content) | |
| { | |
| WriteEvent(1, content); | |
| } | |
| } | |
| } |
The difference between them are the order of the methods. If you notice in the failing ETW tracing class the FailedTraceEvent is Second and the FailedDetailedEvent is first which is causing the trace not to be generated. The actual exception text would
Event FailedDetailedEvent is givien event ID 1 but 2 was passed to WriteEvent.
It’s one of those quirks that I ran into when building ETW tracing.
How to troubleshoot these kind of failures?
By default these kind of failed ETW exceptions would not be raised to be handled by the client code. The reason being,in production if you enable ETW tracing and all of a sudden the application crashes would not be something that we would want.
To troubleshoot this, use ETW tracing for exceptions. Use ETW to trace custom ETW failures. How cool is this? My choice of tool is Perfview.
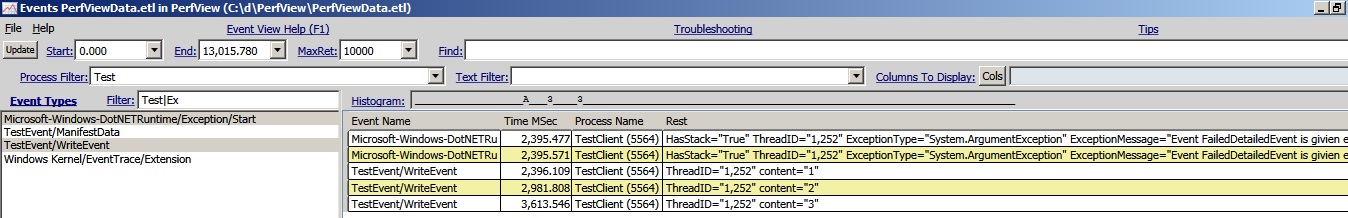
Within Perfview in the Events Window I enter Test|Ex in the filter text box which is shown in the above picture. FYI filter text box supports Regular expression. So by entering Test|Ex, I am filtering events with Test or Ex which for exceptions. With that information I could filter all the TestEvent’s and any exceptions that have been raised which shows ArgumentException.
The call-stack of the ArgumentException shows on the static contructor .cctor of FailedEvent.

